Meet Oddbot
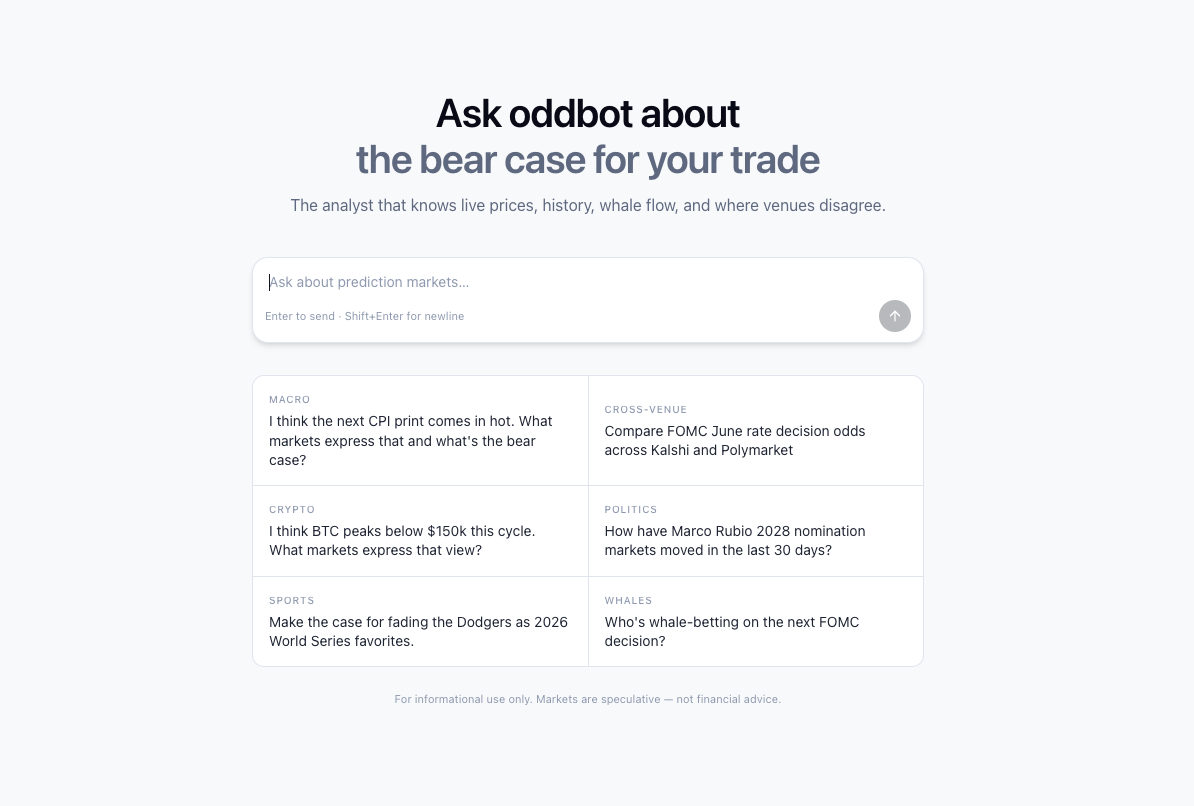
We launched Oddbot, an AI analyst that knows every market on Kalshi and Polymarket. Ask it anything — current prices, historical moves, whale positioning, cross-venue spreads — and it answers with the same data the rest of Oddpool runs on.
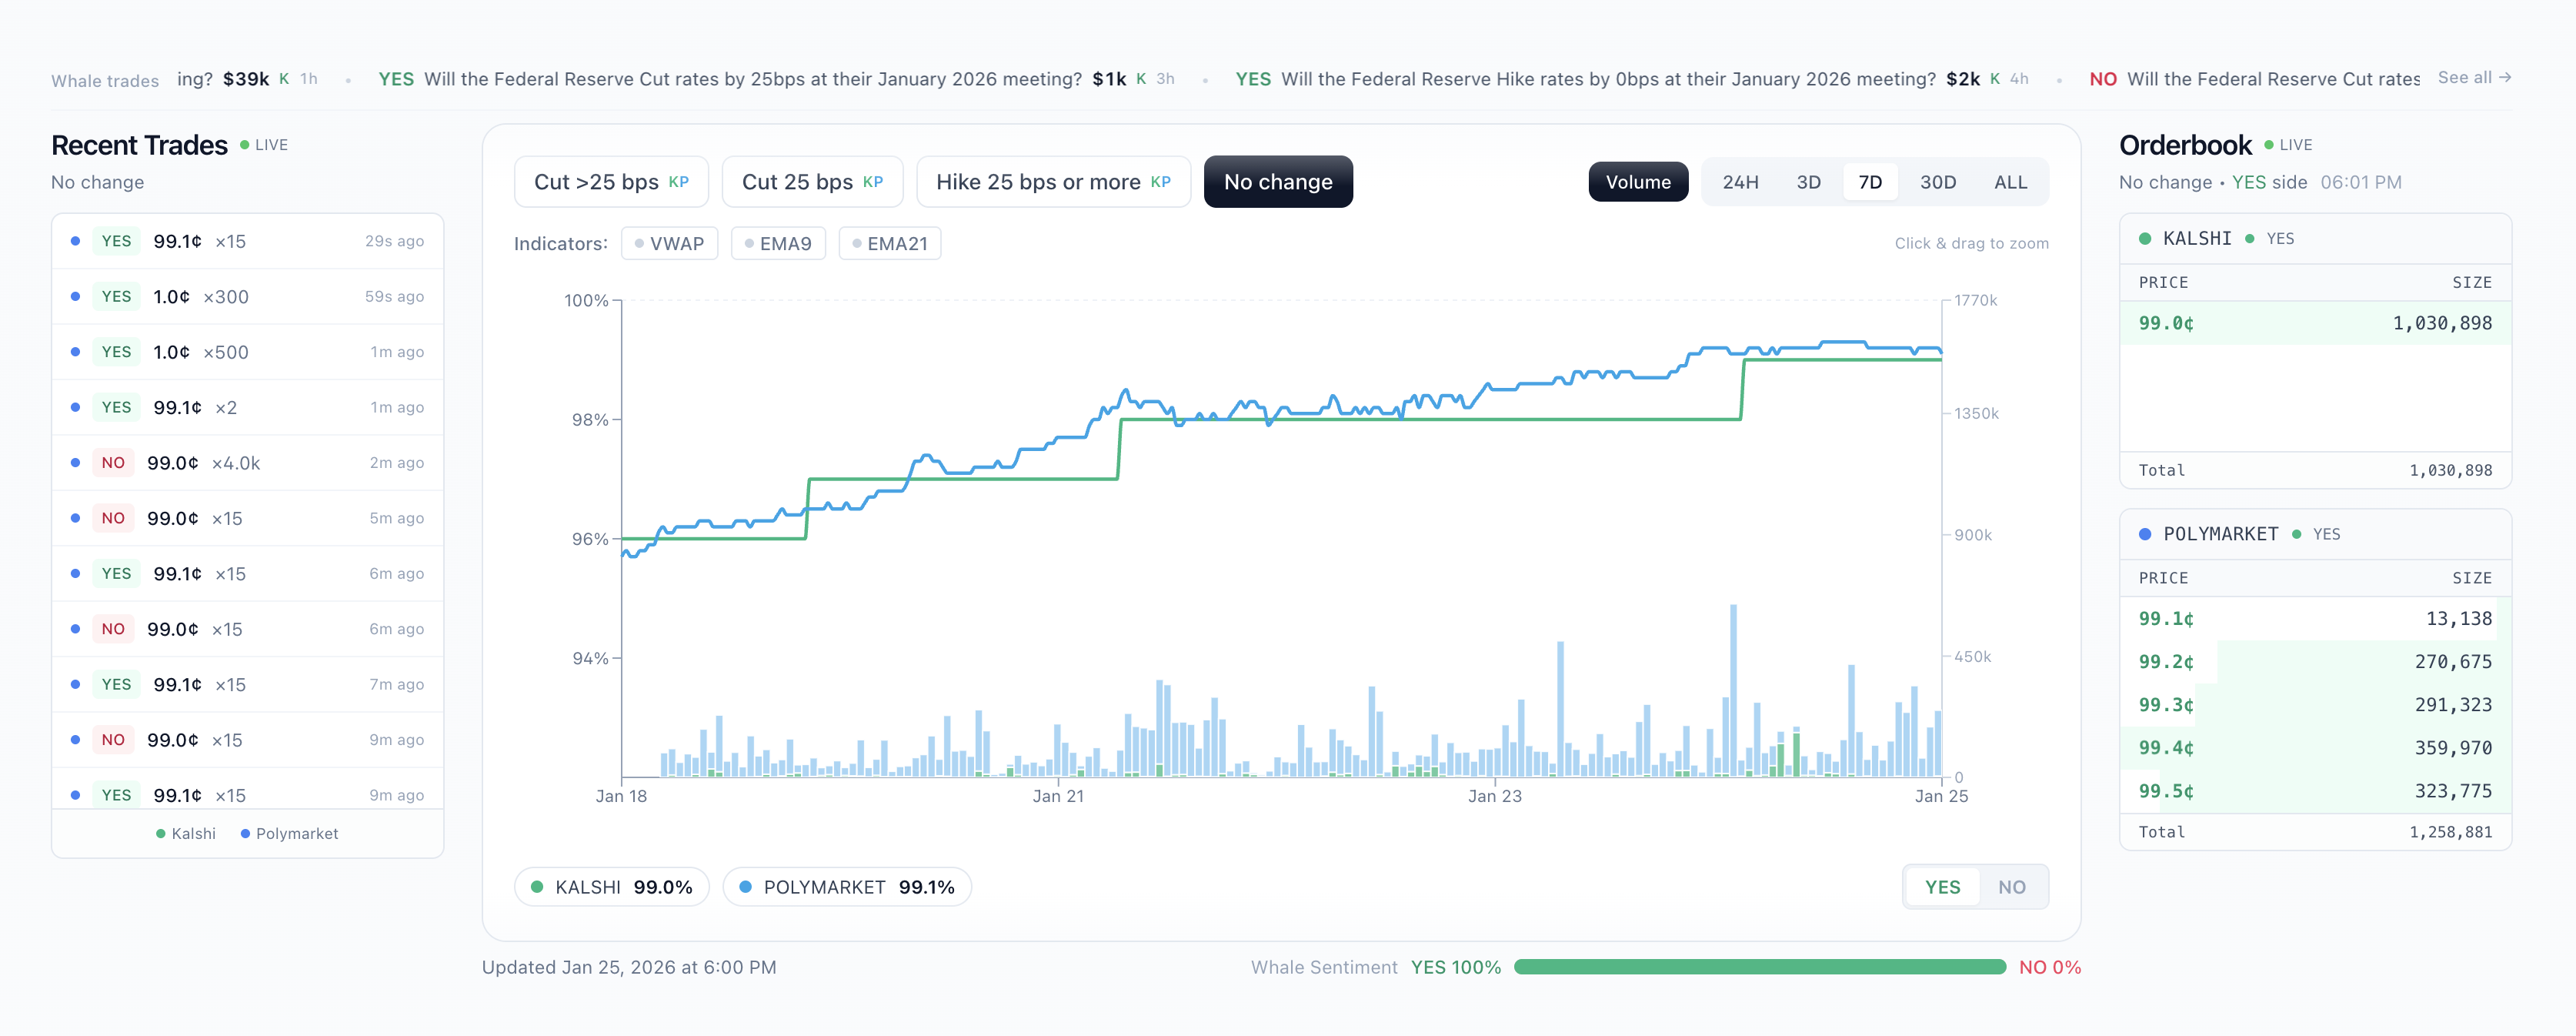
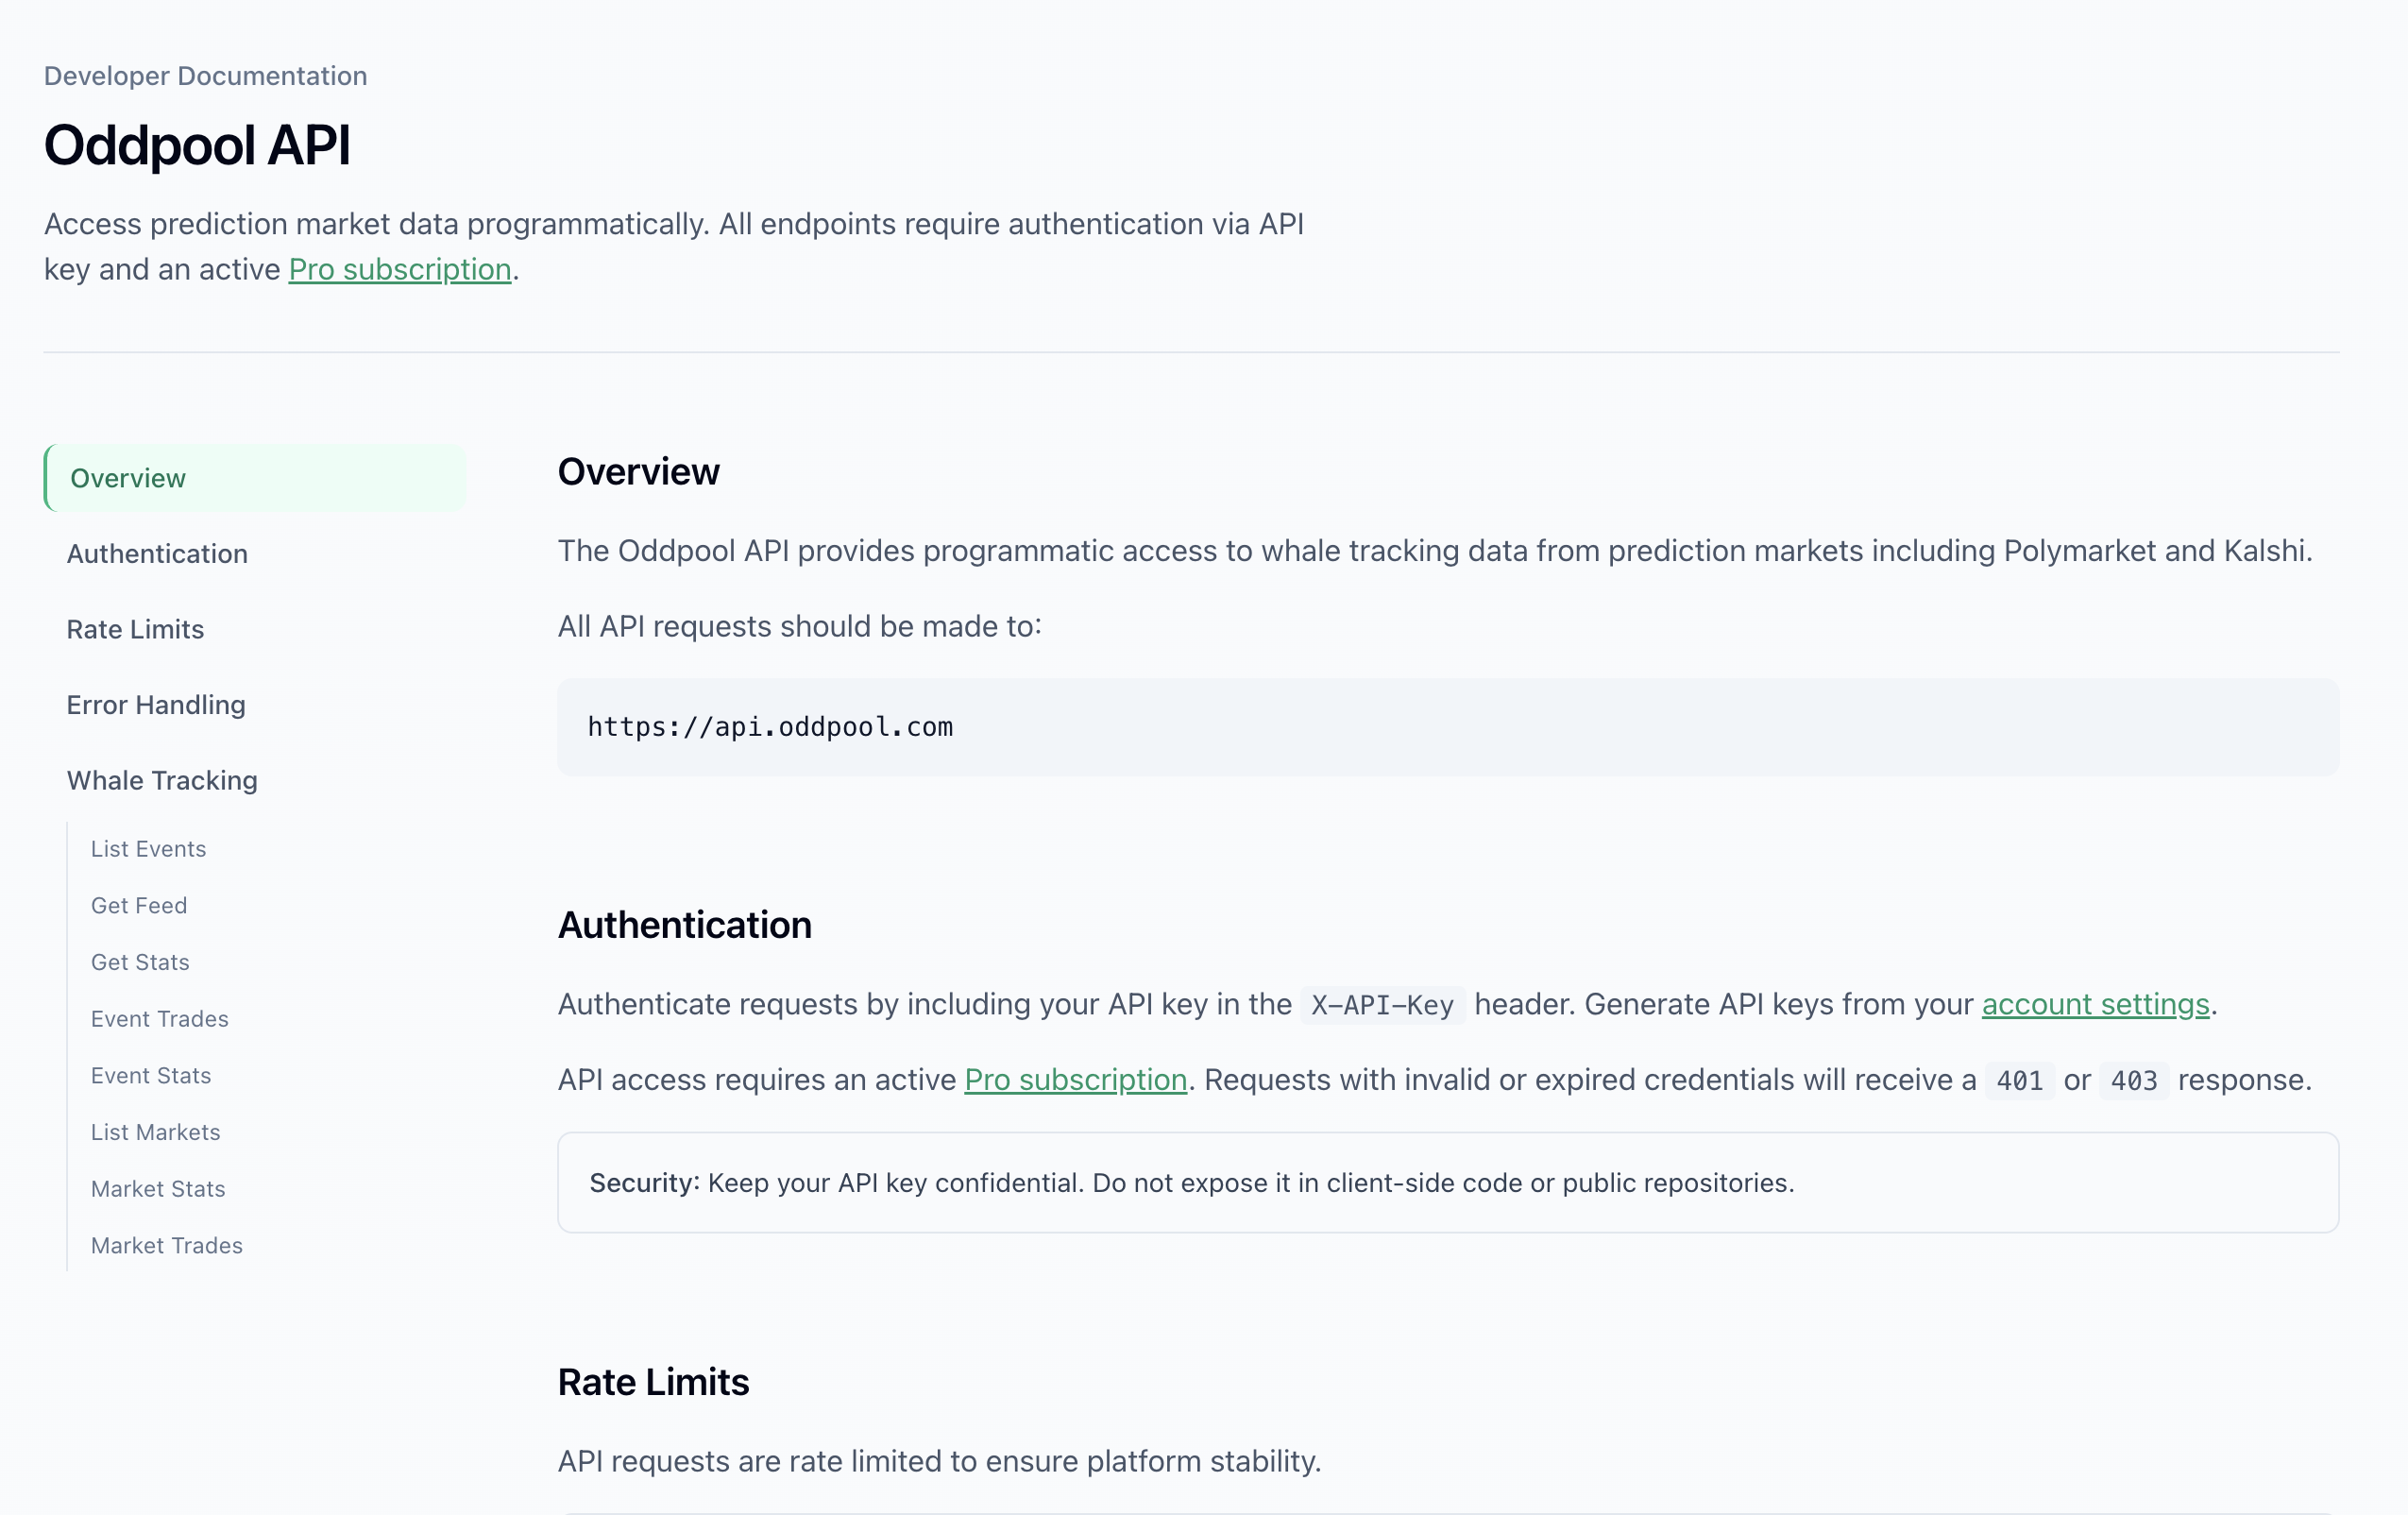
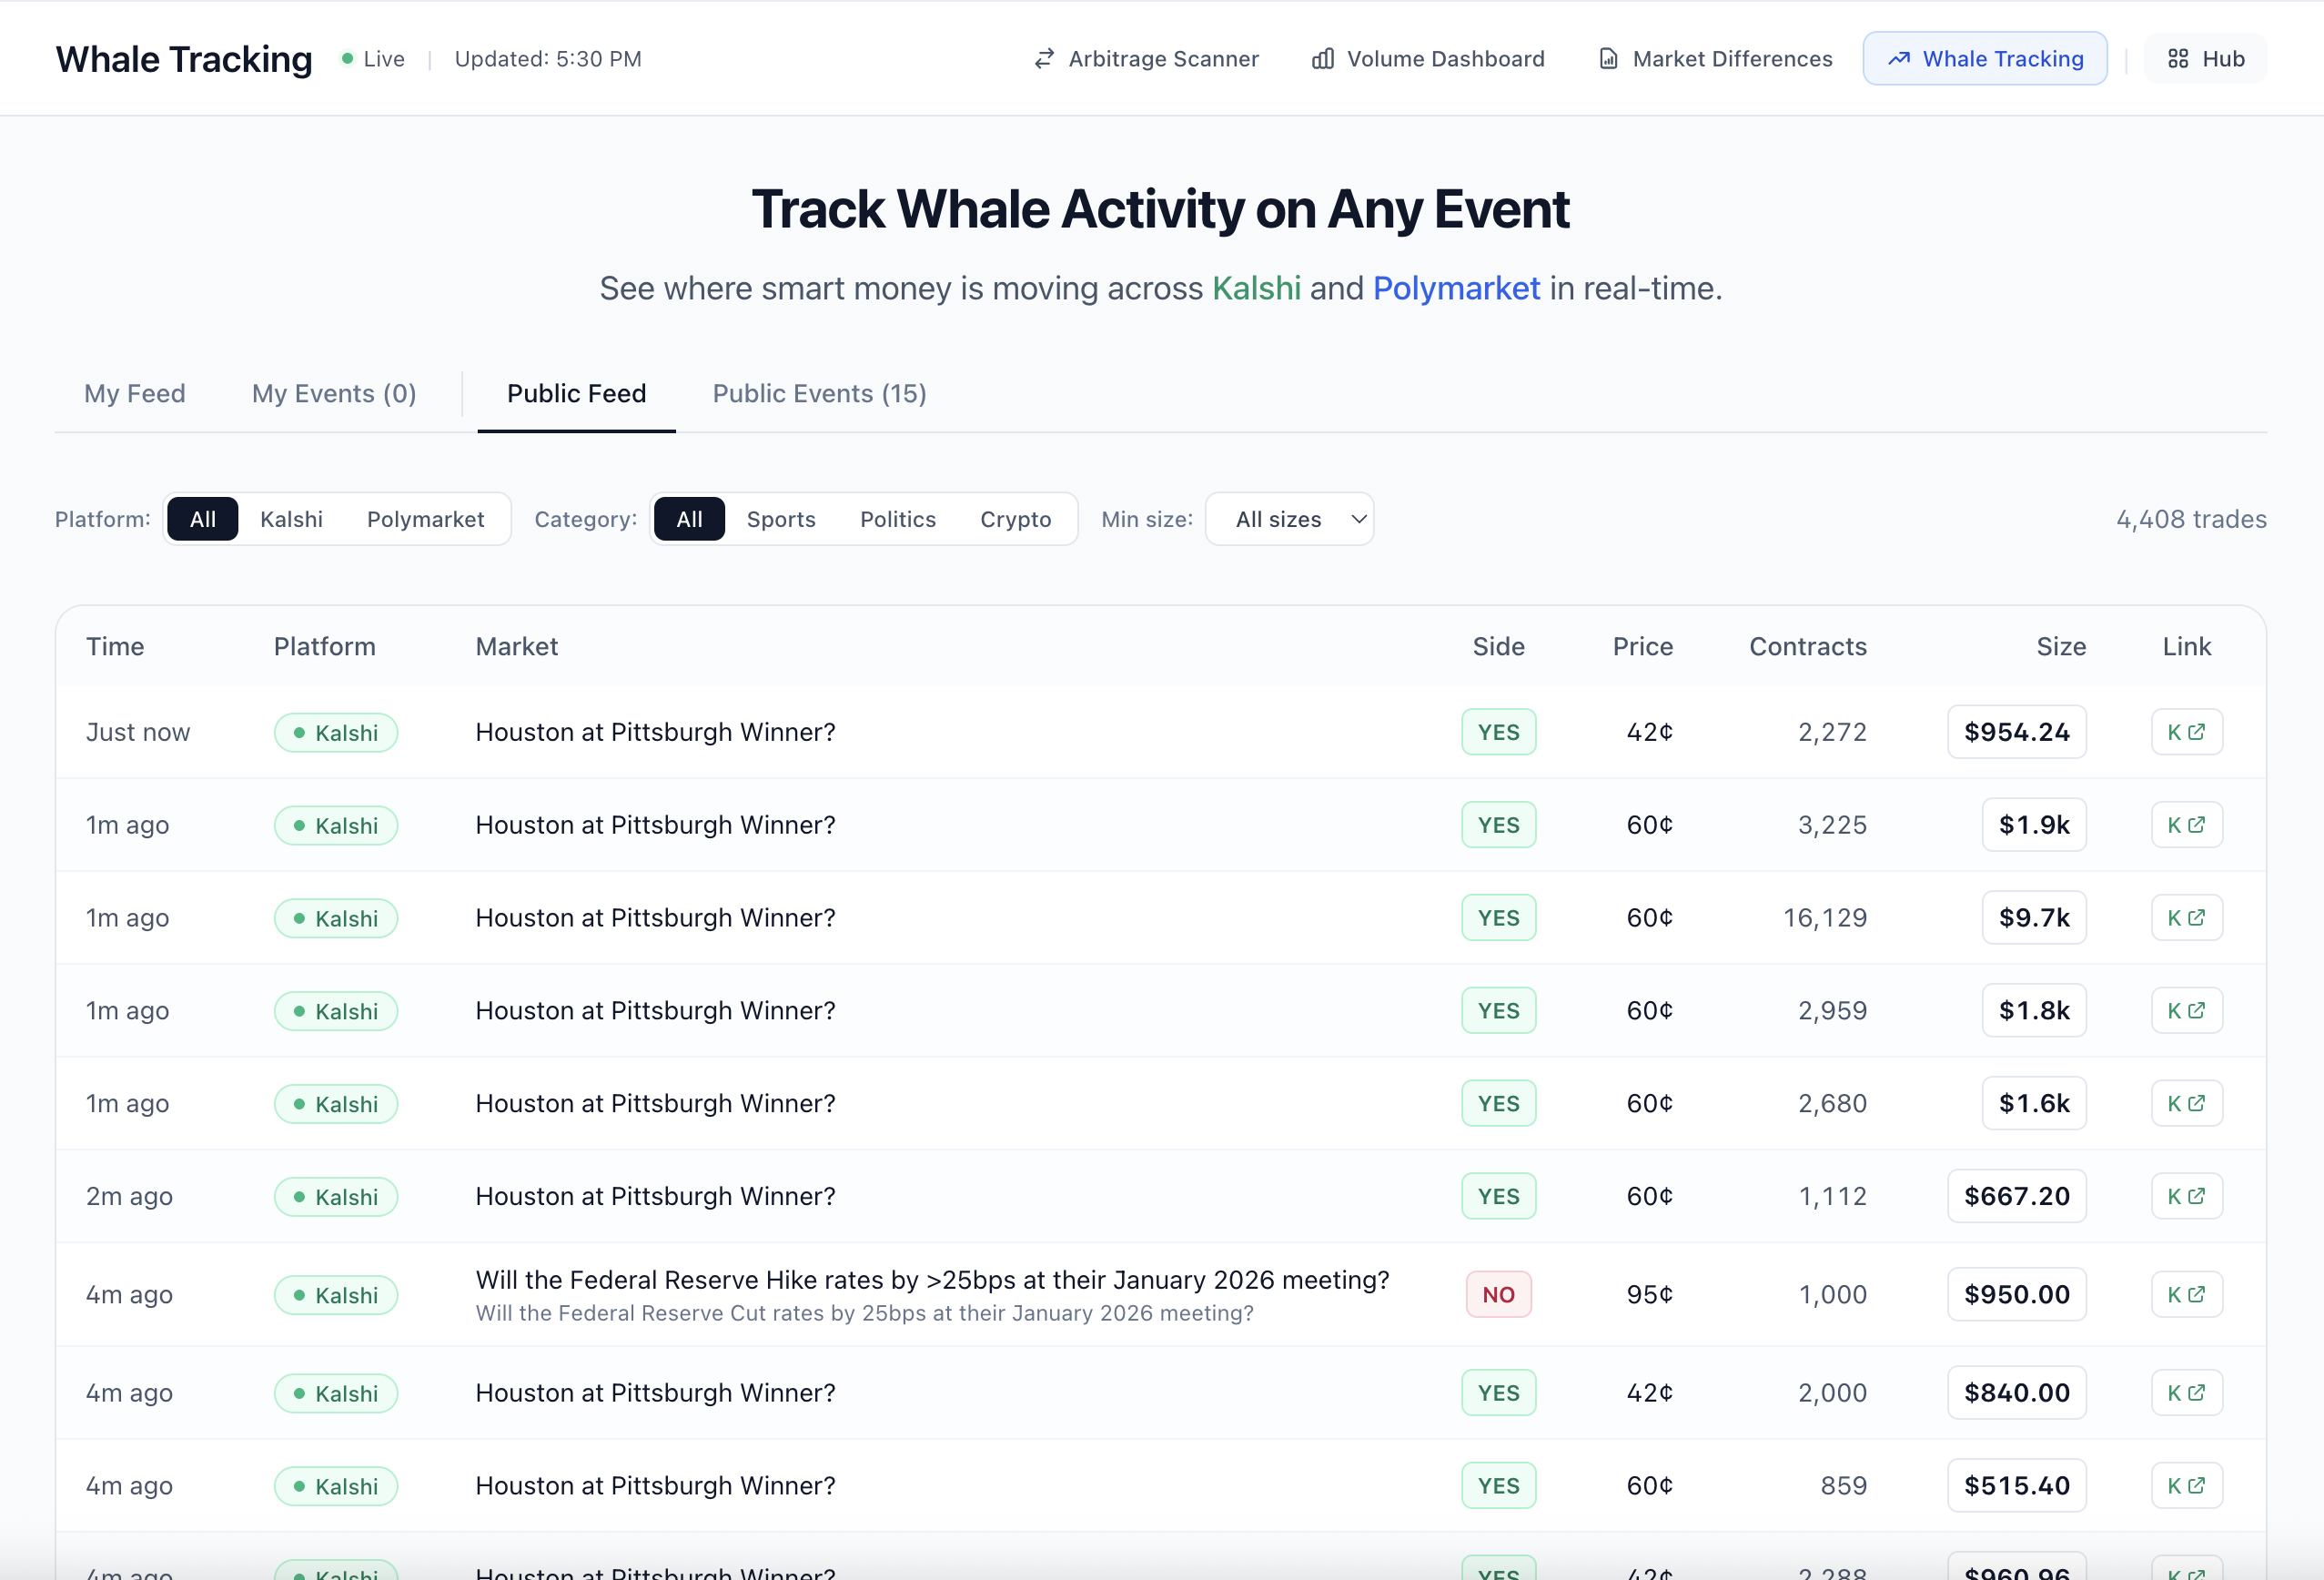
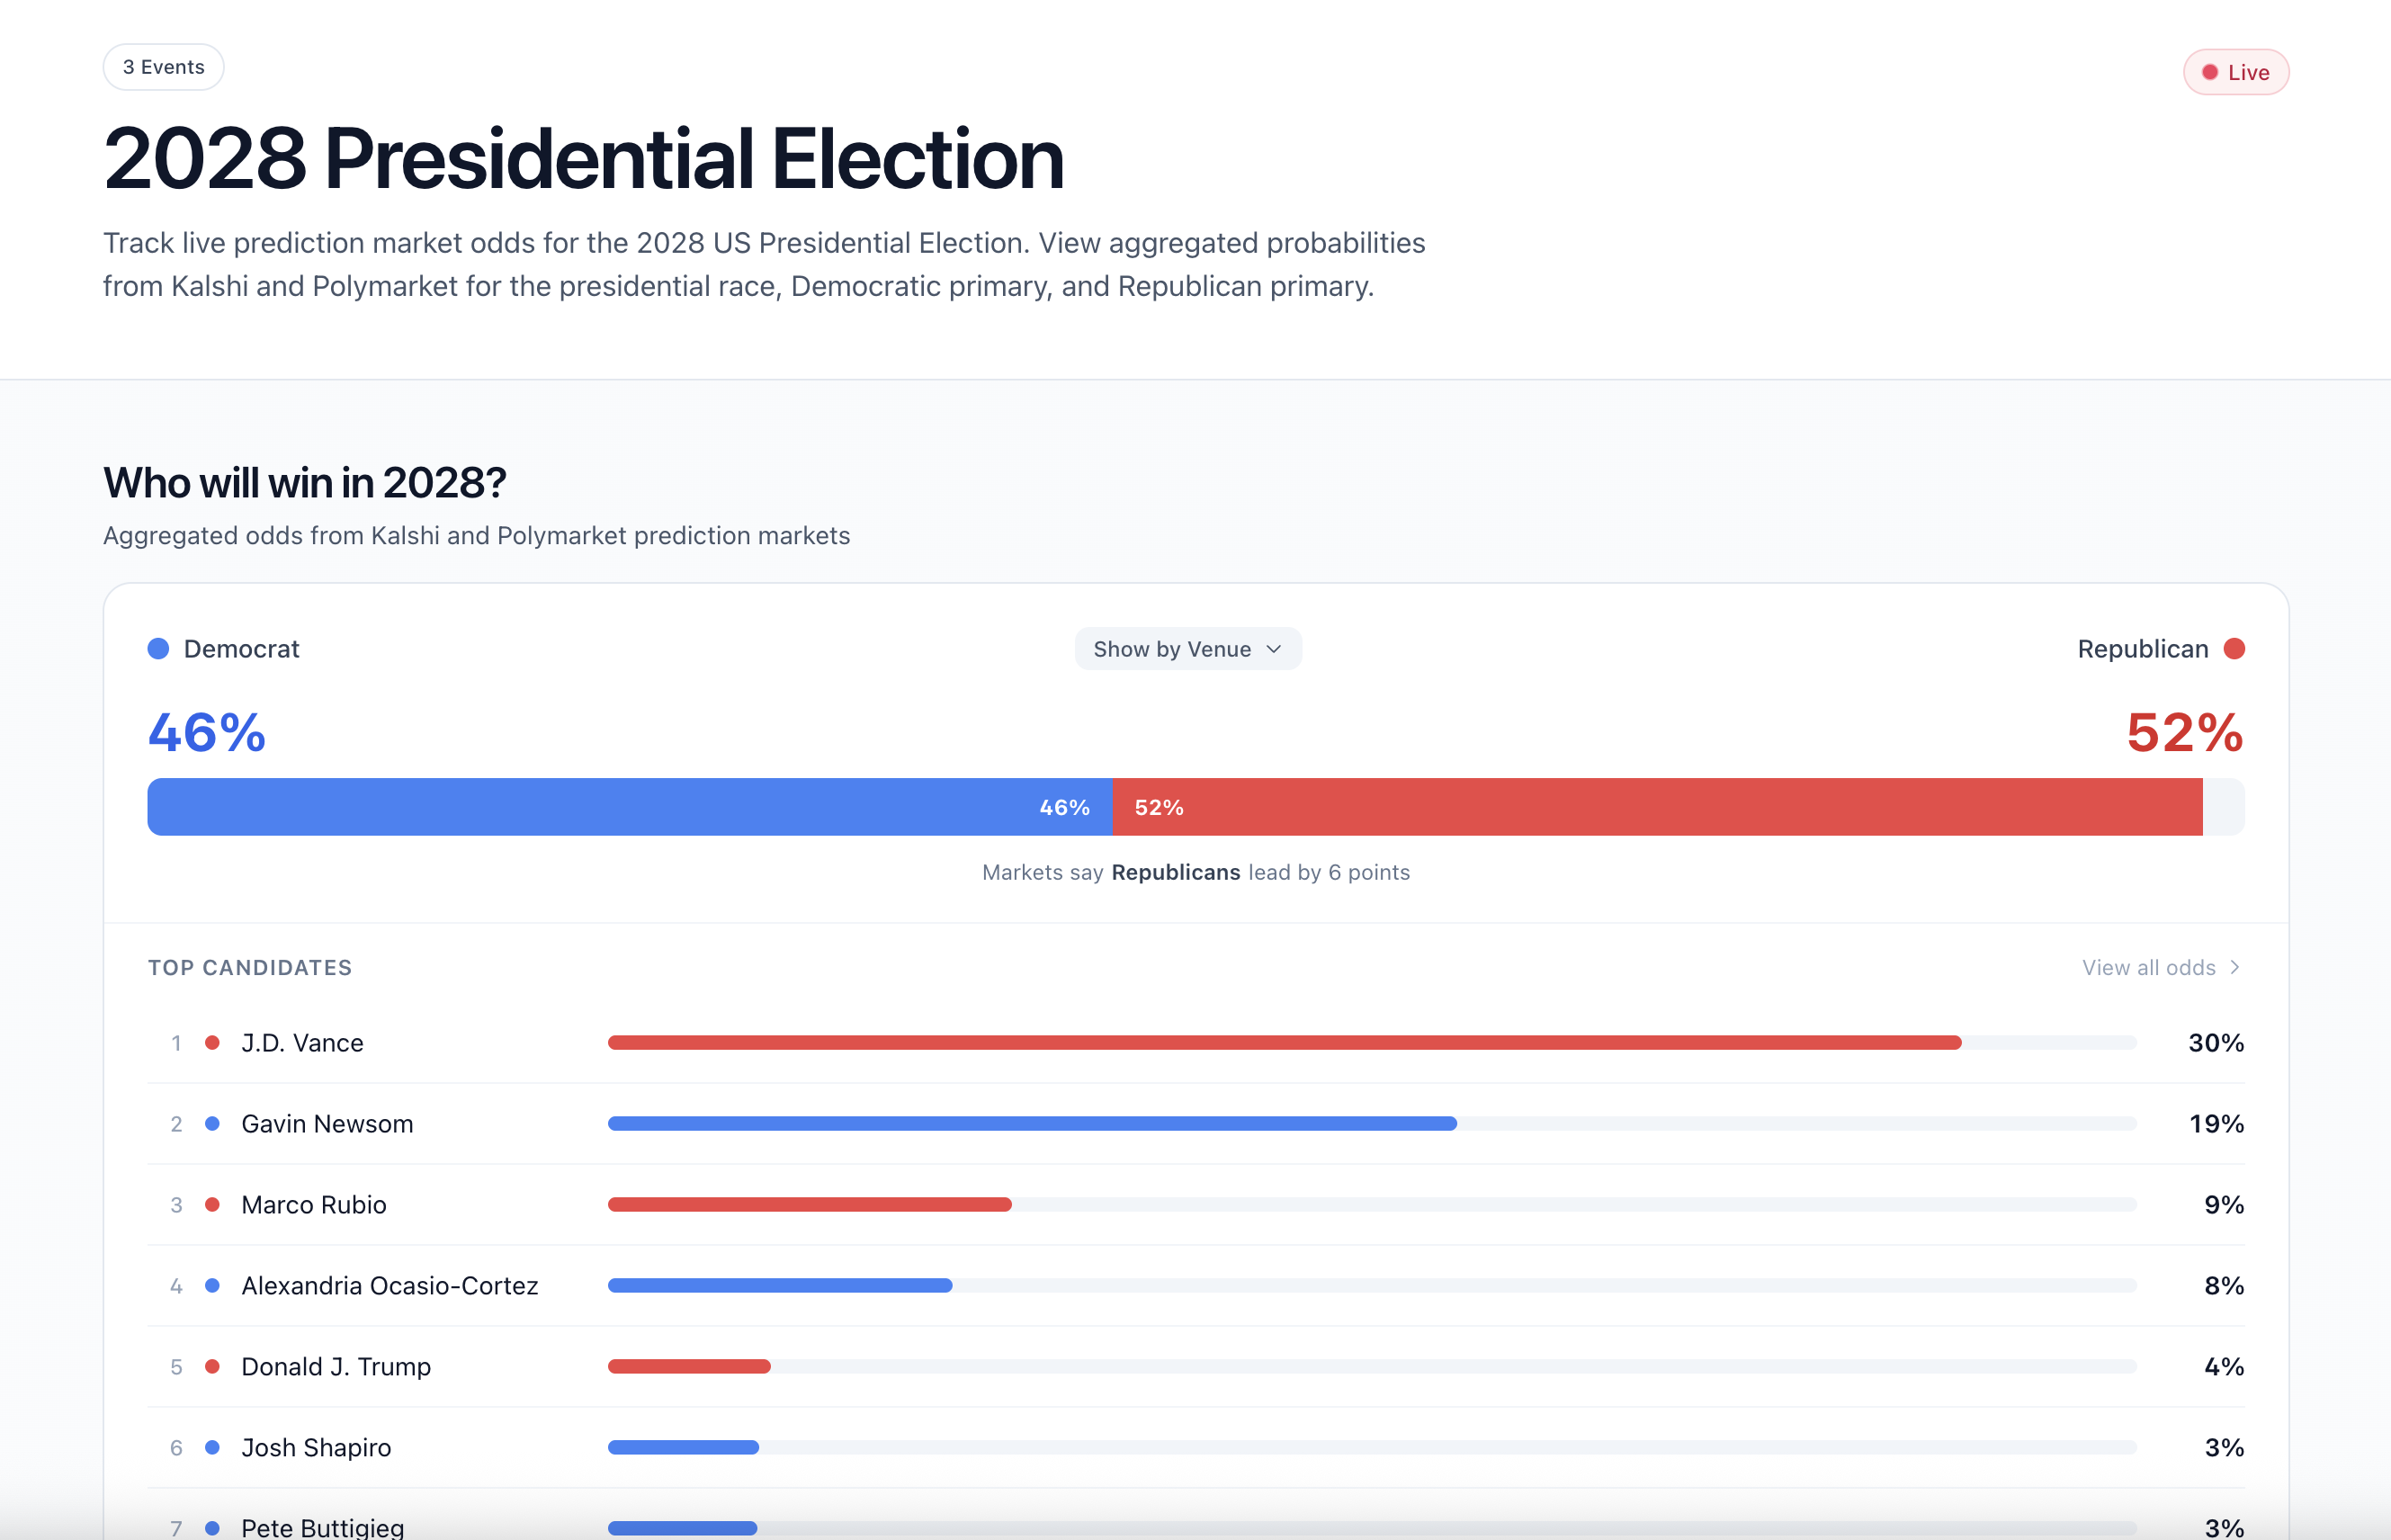
This isn't a generic chatbot pointed at the internet. Oddbot has live access to every orderbook, every trade, every snapshot we collect. It can compare prices across venues, pull a 30-day history on a specific outcome, surface whale flow on the markets you care about, and pressure-test a thesis you walk in with — all in one chat. ChatGPT and Claude can't do any of that without our data.
We built it because the best traders we know don't just want numbers, they want a second pair of eyes. Someone to bounce a view off of, surface the counter-case, and point at the cleanest market to express it. Oddbot does that on demand.
What it can do:
- Look up current prices on any market — single-venue or cross-venue
- Pull historical OHLCV across any window, plot it inline
- Surface whale activity on events you ask about
- Find markets across both venues for any topic, ranked by relevance or volume
- Pressure-test a trade thesis with the live data + macro context
- Cite every number it states, with a link straight to the source market
Try it free at oddpool.com/chat. Free signed-in users get plenty of usage to dig in; Pro and Premium plans unlock more for serious daily use.
We've been using Oddbot internally for two weeks and it's already changed how we research markets. Excited to see what you do with it.